Measured Moves
Chart Patterns
Chart Patterns - Measured Moves: A measured move can form in a bull or bear market. Basically it consists of three parts.
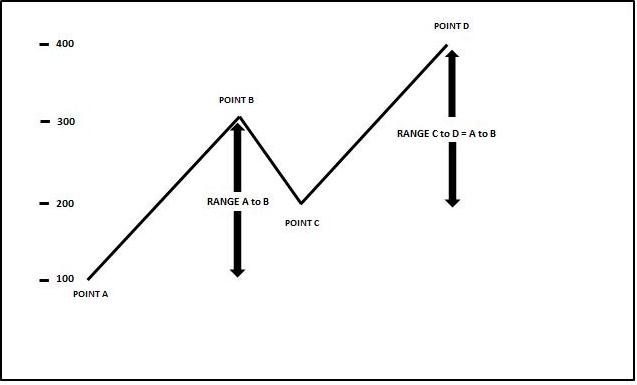
In a bullish measured move, the market makes a significant advance, then retraces before making a new and higher low, then advances to make new highs. The secondary advance often repeats the first advance.
Similarly, in a bearish measure move, the market makes a significant decline, rallies to make a new and lower top and then declines to new lows. Often the secondary decline will repeat the first decline.
Below is the basic anatomy of a bullish measured move.

This pattern typically forms in a trending market and similar moves can repeat themselves a number of times in series. It can form in any time frame, i.e. on intra-day, daily, weekly and monthly charts.
- The initial advance should be significant in the relevant time frame in that it is clearly advancing to make new highs.
- A top forms and the market begins to retrace.
- There is no certain way to anticipate how far the market will decline. Often the market will decline between 37.5% and 62.5% of the advance.
- The market may then form new low from which it rallies sharply or consolidates for a period before making a new advance.
- Traders like to see volume increase when the secondary rally begins as it demonstrates conviction in the direction of the market.
- The advance should break above the previously formed top. It may meet some resistance at this price but to complete the pattern it need to make new highs.
- Traders often use the initial range to estimate a target for the market to reach. This target is only an estimate as the market may fall short or exceed the target.
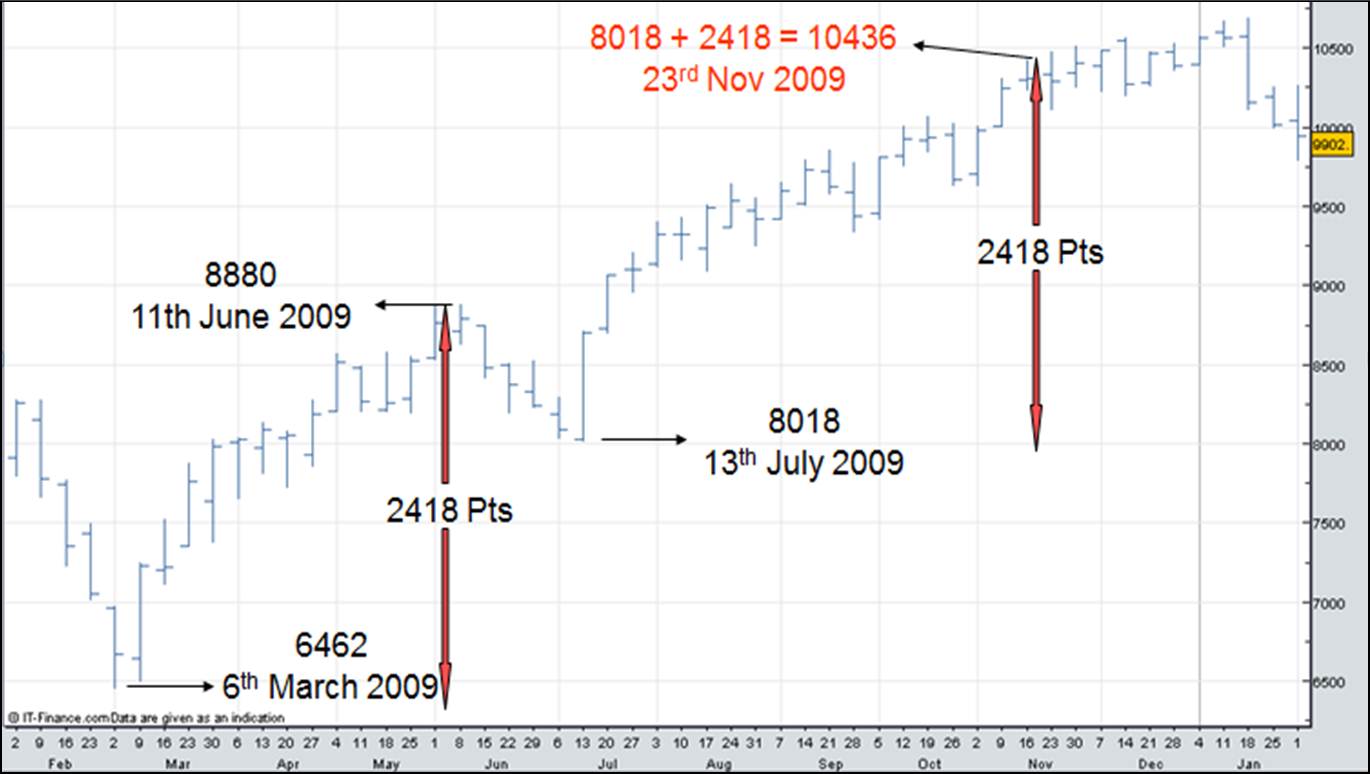
Examine the weekly bar chart of the Dow Jones Index below which follows the basic anatomy of a bullish measured move demonstrated in the previous chart. It is a spread betting chart so although the figures may vary slightly with the actual index itself, the difference is marginal.
- The initial move begins on 6th March 2009 at 6462 when the market made a significant low, advancing to 8880 on 11th June.
- The market then declines 862 points to 8018 on 13th July, a retracement of 35.6%.
- A sharp rally commences during that week.
- Traders may see this as the start of a measure move as support at a higher bottom has formed.
- To estimate a target they would add the first range of 2418 points to the low on 13th July to get a target of 10436. (8018 + 2418).
- The market reached 10436 on 23rd November 2009 and met strong resistance for several weeks at this level.

Chart Patterns - Measured Move Up. View chart in interactive mode at ProRealTime.com.
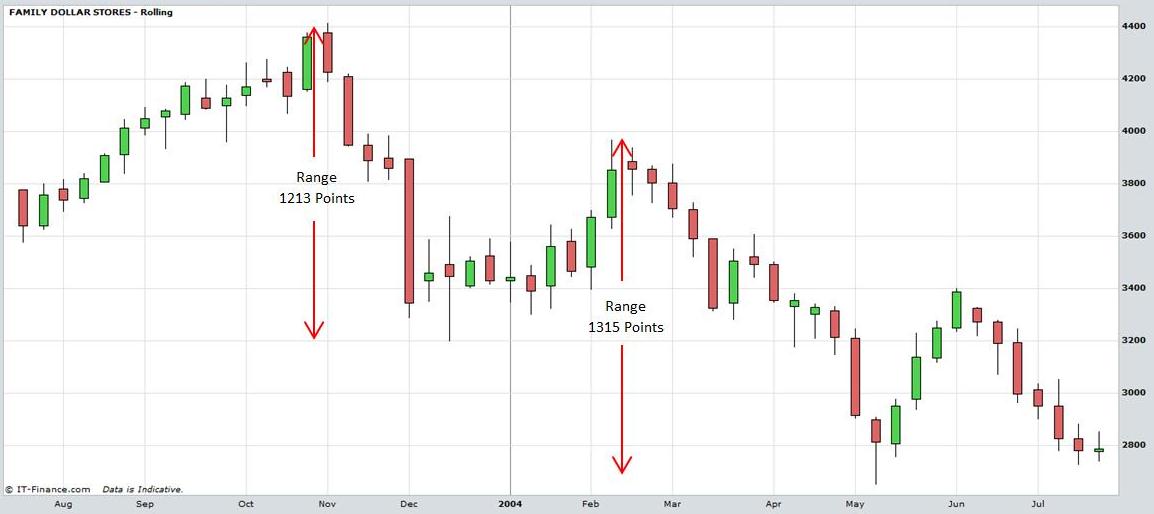
Measured moves also occur in a downward trending market as demonstrated in the weekly candlestick chart of the stock Family Dollar Stores below.
- The market makes a top at 4413 on 3rd November.
- Prices decline sharply to form a low on 16th December at 3200.
- The range of the decline is 1213 points (4413-3200).
- The market rallies 63.1% to form a lower high on 12th February at 3966.
- Traders would
estimate a new decline to repeat the previous range giving a target of 2753
(3966 – 1213). On this basis they may take a short position.
- Prices recommence their decline to form a new low on 12th May at 2651. Traders like to see volume increase as the decline begins because it indicates greater selling than buying pressure.
- The decline was 1315 points or 108% of the previous decline.
Traders should adopt appropriate risk management and stop loss strategies when trading measured moves.

Chart Patterns - Measured Move Down
Return to Top of Chart Patterns: Measured Moves
Return to Technical Analysis Charts