Day Trading Forex Currency
Candlestick Charts Part 4
Day Trading ForexCurrency: Candlestick Charts Part 1, Part 2 and Part 3 covered individual types of candlesticks, candlestick pair formations and how to interpret them. This page outlines candlestick formations that involve three bars. Although useful in interpreting price behaviour they are not stand alone indicators and should be used in combination with chart patterns or other technical analysis indicators.
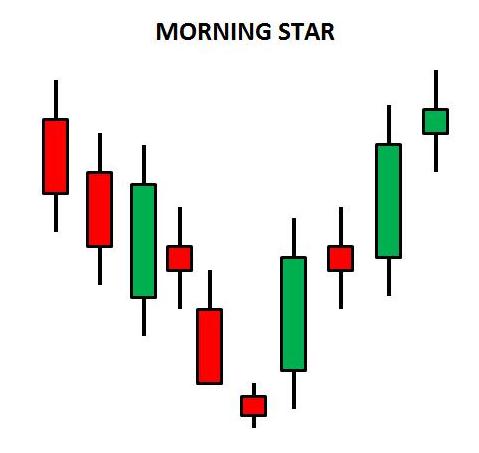
The Morning Star formation is a bullish reversal pattern. Its characteristics are:
- A long bearish red candle extending the current downward trend.
- A short candle that gaps down below the close of the previous day. It may be green or red.
- A long green candle that closes at least above the midpoint of the first candle.
The second candle indicates the market may be losing downward momentum. Although the market gaps down it doesn’t move much during the day. The third candle is a strong rally that confirms market sentiment has changed to bullish, at least in the short term. This formation is more significant if it occurs at an important support level.
Day Trading ForexCurrency: Candlestick Charts
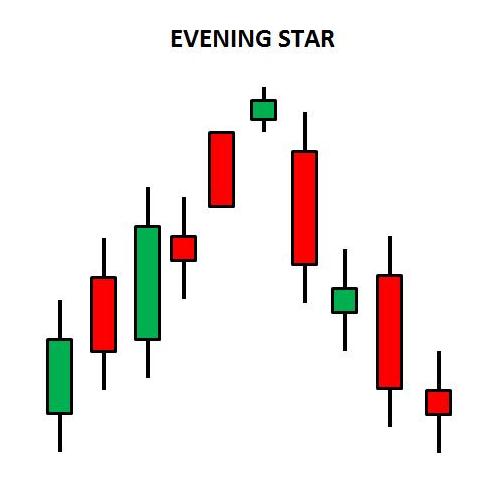
The Evening Star formation is a bearish reversal pattern. Its characteristics are:
- A long bullish green candle extending the current upward trend.
- A short candle that gaps up above the close of the previous day. It may be green or red.
- A long red candle that closes at least below the midpoint of the first candle.
The second candle indicates the market may be losing upward momentum. Although the market gaps it doesn’t move much during the day. The third candle is a strong decline that confirms market sentiment has changed to bearish, at least in the short term. This formation is more significant if it occurs at an important resistance level.
Day Trading ForexCurrency: Candlestick Charts
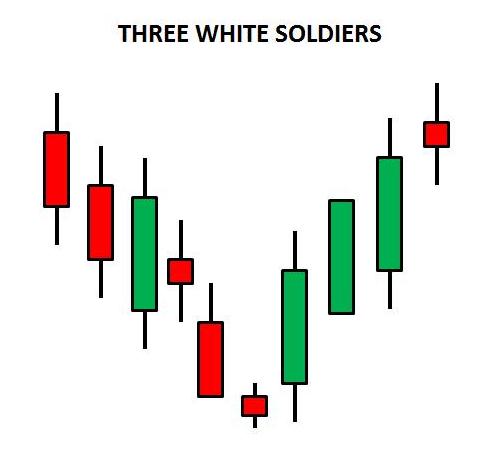
Three White Soldiers is a bullish reversal pattern. Substitute the word black for red if you wish. Most charting software display candlesticks as red and green rather than black and white but the only difference is colour. It consists of three long green candles in a row. They form at the end of a downtrend and are a strong signal of a bottom in the market. The formation can also occur at the beginning of a breakout after a period of consolidation.
The characteristics of Three White Soldiers are:
- A long green candle that indicates the end of a downtrend or breakout from consolidation.
- A second long green candle that continues the rally and closes near the high of the day.
- A third long green candle that drives the market higher and also closes near the high of the day.
This formation is more significant if it occurs at an important support level. Some technicians look for the second candle to be longer than the first and the third to be at least as long as the second. This is quite a strict interpretation. As long as the candles are long and consistently close near the highs of the day it’s still a strong signal. Typically a long candle is one that is above the average daily range of that particular market. Traders will recognise these days the more familiar they become with daily moves. Average True Range is a technical indicator that can help with this study.
Day Trading ForexCurrency: Candlestick Charts
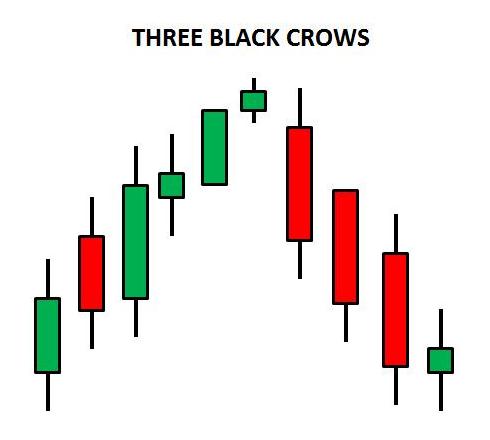
Three Black Crows is the counterpart of Three White Soldiers. It is a bearish reversal pattern that consists of three long black candles in a row. They form at the end of an uptrend and are a strong signal of a top in the market. It has even more significance if it occurs at an important resistance level. The formation can also occur at the beginning of a breakout after a period of consolidation.
The characteristics of Three Black Crows are:
- A long red candle that indicates the end of an uptrend or breakout from consolidation.
- A second long red candle that continues the decline and closes near the lows of the day.
- A third long red candle that drives the market even lower and also closes near the low of the day.
Day Trading ForexCurrency: Candlestick Charts
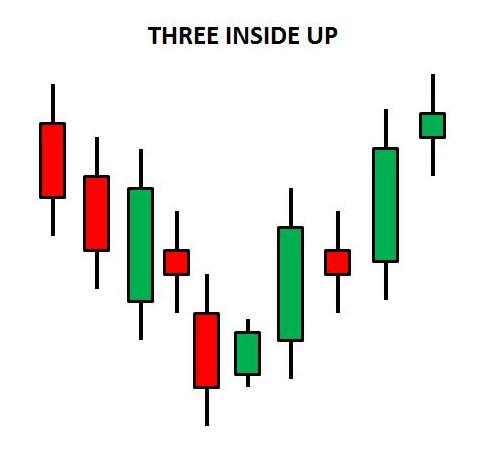
The Three Inside Up formation is a bullish reversal pattern. Its characteristics are:
- A long bearish red candle extending the current downward trend.
- The second candle is green candle and closes at least above the mid-point of the first candle. It also trades within the body of the previous day. This is known as a Bullish Harami.
- The third candle is a long green candle that closes above the high of the first candle.
Once again, it is more significant if it manifests at an important support level.
Day Trading ForexCurrency: Candlestick Charts
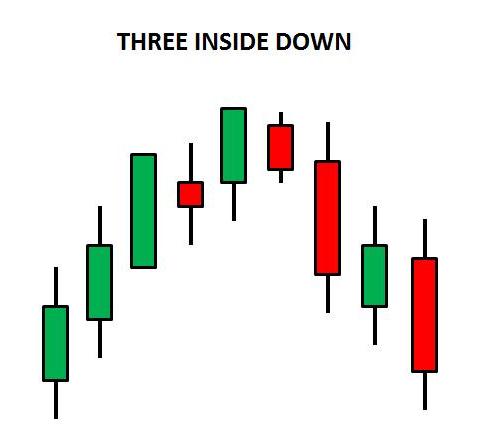
The Three Inside Down formation is a bearish reversal pattern. Its characteristics are:
- A long bullish green candle extending the current upward trend.
- The second red candle closes at least below the mid-point of the first candle. It also trades within the body of the previous day. This is known as a Bearish Harami.
- The third candle is a long red candle that closes below the low of the first candle.
It is more significant if it emerges at an important resistance level.
In conclusion, candlesticks are a useful way of analysing price behaviour in the market. Candlestick analysis can be applied to Stocks, Exchange Traded Funds, Currency Futures / Forex, Commodities, Bonds etc. It should always be remembered, however, that they are not stand-alone indicators either as a single candle or a group formation. Always interpret them in context with the bigger picture. Combine candlestick analysis with chart patterns or other technical analysis studies. Ask yourself what the price behaviour is indicating about current market sentiment. Is it signalling a possible change in price direction? This type of analysis can help a trader to determine when to enter and exit positions thereby improving their trading strategy and risk management.
Return to Top of Day Trading ForexCurrency: Candlestick
Charts Part 4
Return to Candlestick Charts Part 3
Return to Candlestick
Charts Part 2
Return to Candlestick Charts Part 1