Foreign Exchange Trading
Ultimate Oscillator
Foreign Exchange Trading: The Ultimate Oscillator is a momentum indicator developed by Larry Williams. The difference between this oscillator and others is that it uses three time frames in its construction. The advantage of this is that it is less volatile than single time frame oscillators and produces fewer false signals.
Typically the time frames are 7, 14 and 28 periods although they can be adjusted to suit the trader.
The indicator fluctuates between 0 and 100. Crosses above the 70 line indicate prices are potentially overbought. Moves below the 30 line indicate oversold conditions. A cross above 50 is considered positive and below 50 as negative.
The ultimate oscillator measures the buying or selling pressure and its relationship with the true range of the market. Williams calculated buying pressure by measuring the difference between the current periods close and lowest price or previous period’s close, whichever one is the lowest. The oscillator, therefore, rises when buying pressure is strong and declines when buying pressure is weak. The three chosen time periods are averaged and weighted with the shorter one receiving the heavier weighting.
Buy and sell signals are generated when there are divergences between the oscillator and price. Bullish divergence occurs when prices make new lows but the oscillator is rising after having dipped below the 30 level. This indicates that selling pressure is losing momentum and a potential reversal in prices is due. Further confirmation of bullishness is indicated by the oscillator breaking to new highs. When the oscillator crosses over 70 it may be used as a sell signal. Alternatively the oscillator may fail to break through the 50 line and decline again which indicates weakness.
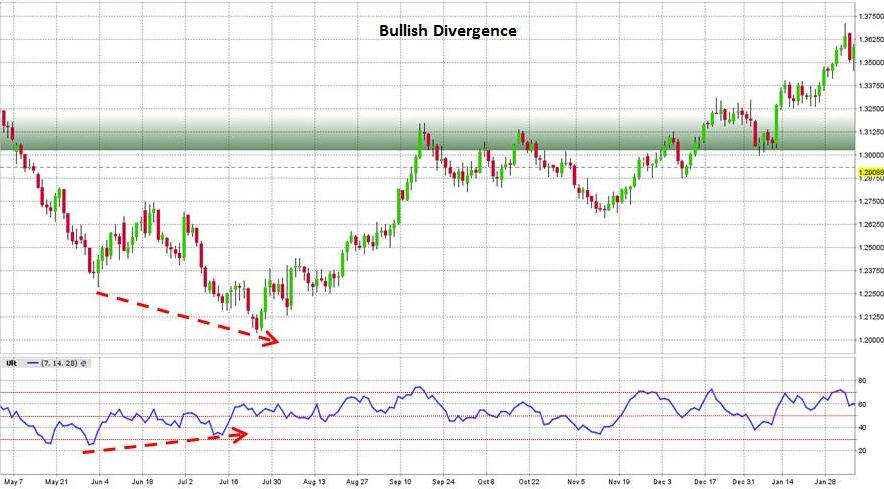
Look at the daily candlestick chart of the EURUSD currency pair below. The market made a low in on 1st June 2012. The ultimate oscillator accompanied this decline and dipped below the 30 line indicating oversold conditions. Following a brief rally, the market continued its trend downwards to make lower lows on 13th and 24th July but the oscillator was rising. This bullish divergence signalled a potential reversal in prices and the market subsequently rallied for many months. Traders may enter a long position as the oscillator makes new highs. Typically, however, traders look for confirmation of their analysis by combining a couple of technical analysis indicators with relevant chart patterns. Of course trading strategies should be implemented with effective risk management and stop loss techniques.

Foreign Exchange Trading: Ultimate Oscilator
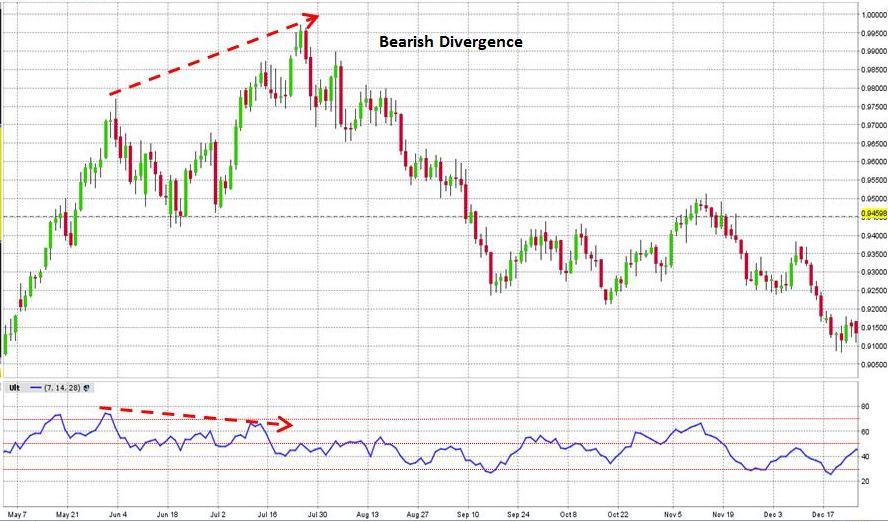
Bearish divergence is a similar process. The next chart of USDCHF shows this market making a high on 1st June 2012. This was accompanied by a rising oscillator over the 70 line. Following a brief decline the market rallied to make higher tops on 13th and 24th July. The oscillator, however, indicated that buying momentum was becoming exhausted as it was declining. This bearish divergence signalled a potential reversal in prices and the market subsequently declined for the rest of the year.

Foreign Exchange Trading: Ultimate Oscilator
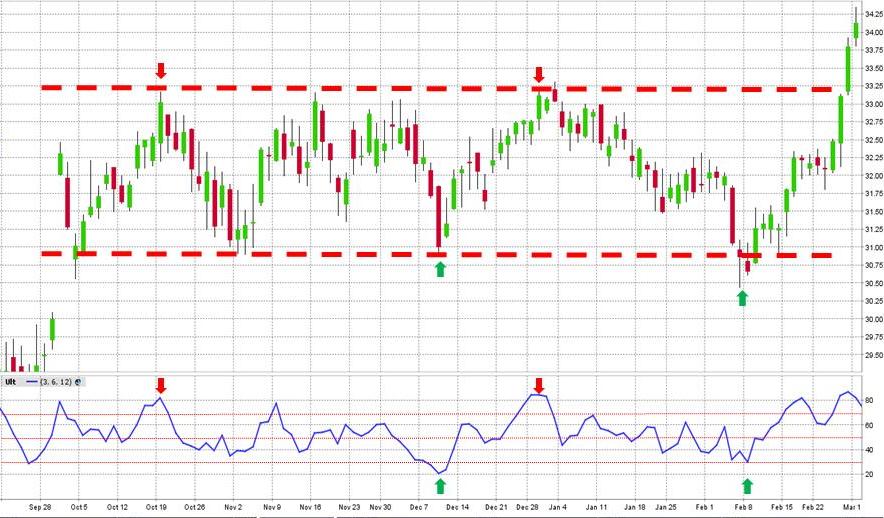
The final chart shows Nike, a stock which was in congestion for five months between October and February. The oscillator can be used to identify overbought and oversold conditions in a sideways market. Prices were trading in a range between resistance near $33.25 and support just under $31. Traders would be on the alert to sell when prices returned to the resistance level and buy as prices reached support. The oscillator can be used as further confirmation. If it rises above 70 in tandem with prices reaching the resistance level it is an additional signal to sell. Prices are both overbought and hitting a resistance level at the same time. Similarly, if the oscillator is indicating an oversold market with prices at the support level it is a further indication to buy.

In conclusion, the ultimate oscillator can be adopted in any time frame and applied to Stocks, Exchange Traded Funds, Futures, Forex, Commodities, Bonds, etc. It is typically used to identify bullish and bearish divergence but should be combined it with other analysis to confirm the signals.
Return to Top of Foreign Exchange Trading: Ultimate Oscillator