Online Forex Trading Systems
Chaikin Volatility
Online Forex Trading Systems: The Chaikin Volatility indicator was developed by Marc Chaikin. This indicator effectively compares the spread or range between the high and low prices of a financial security. This is done by first calculating a moving average of the difference between the high and low prices and then calculating the percentage rate of change of that moving average. Chaikin himself recommended using it as a confirmation indicator along with other technical analysis indicators.
- Look for sharp increases in volatility prior to market tops and bottoms, followed by low volatility as the market loses interest.
- A volatility spike can occur just before the market makes a new top.
- A quick decline in volatility could indicate that the market has lost momentum and a reversal is imminent.
- A low volatility reading occurs when the market is in a trading range.
- Volatility may rise as prices break above the recent high.
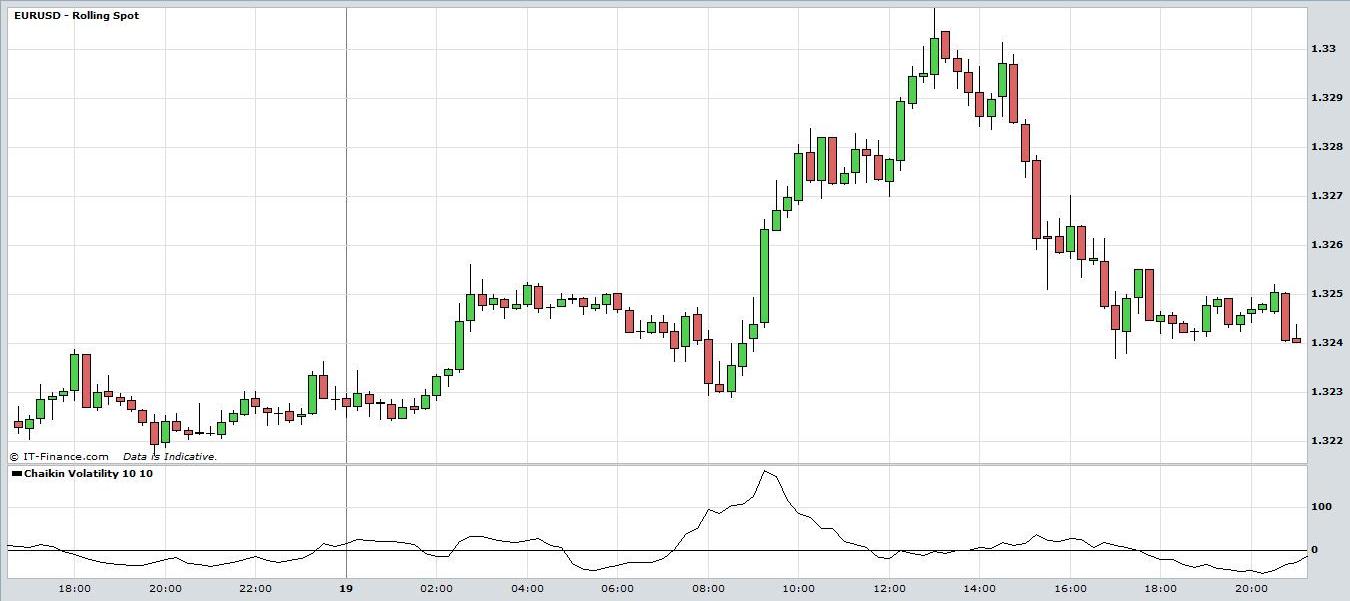
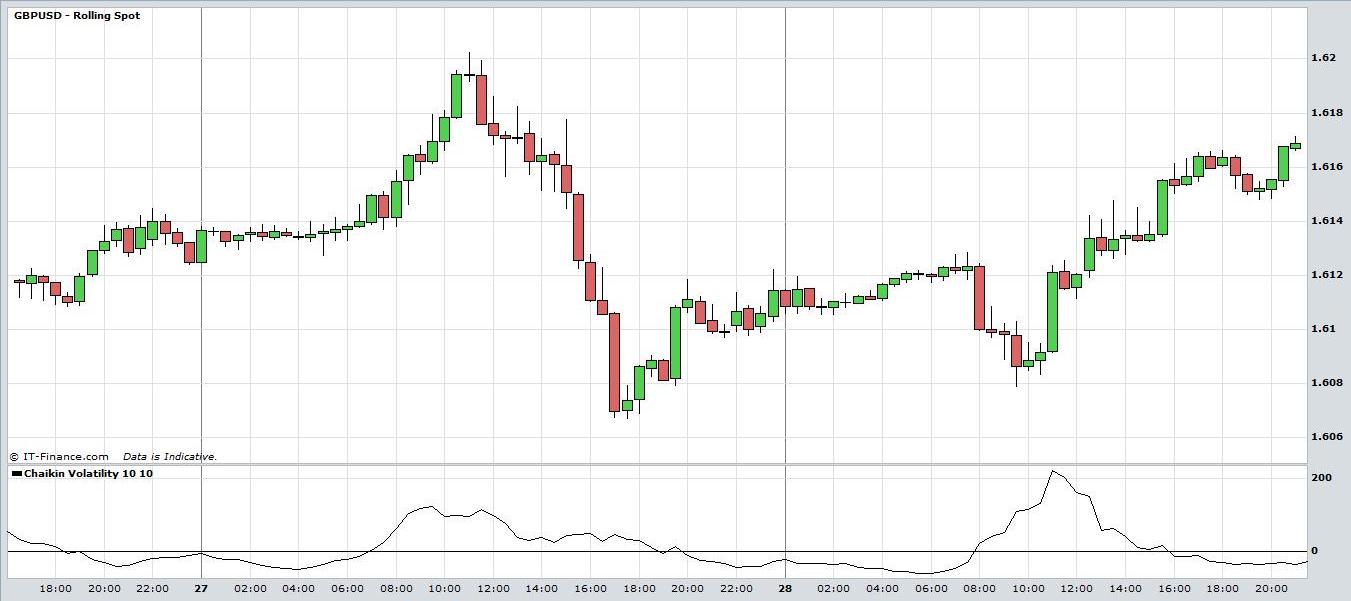
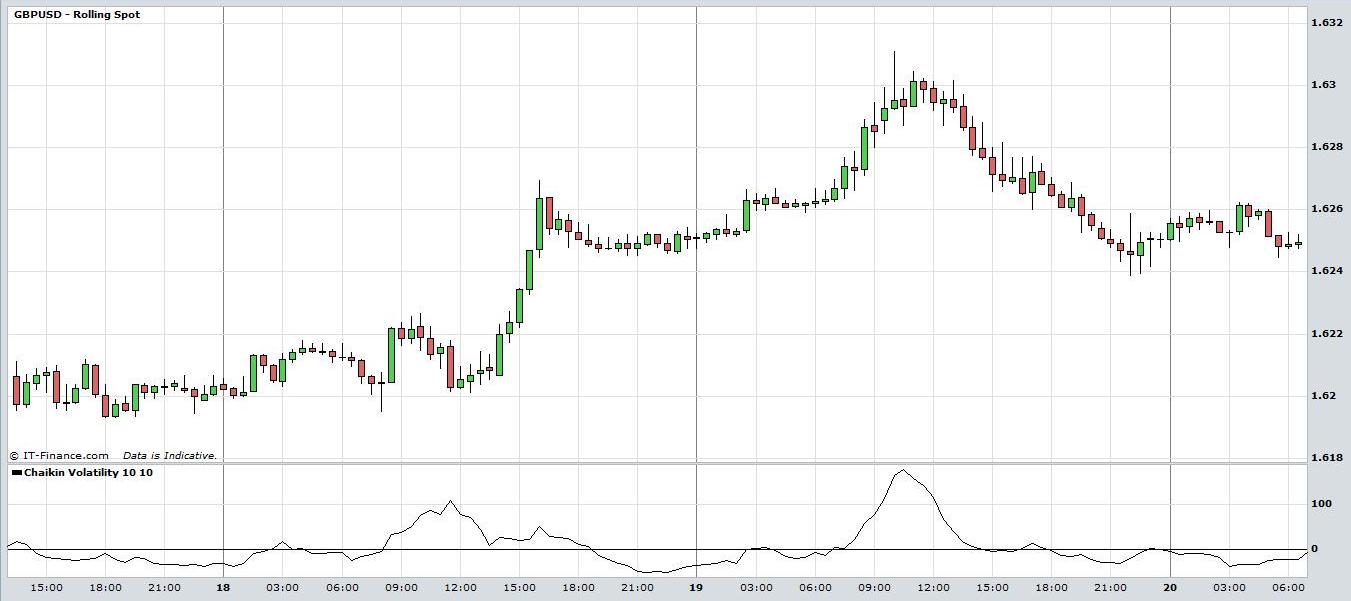
Examine the following intra-day candlestick charts of the EUR/USD and GBP/USD forex pairs for periods when Chaikin Volatility rises and falls.
In the chart of the EUR/USD currency pair below the volatility indicator remains low when it is in a trading range in the first half of the chart. As prices spike towards a top the indicator rises sharply. However, the indicator declines before the market tops out anticipating the price action. As the market loses momentum and declines volatility decreases again.

Online Forex Trading Systems: Chaikin Volatility. View charts in interactive mode at ProRealTime.com.
In the next chart of GBP/USD the volatility indicator spikes upwards before the market tops out and then declines as the market loses momentum and settles into a trading range. As prices break higher, the volatility indicator increases again.

Once again, in the following chart of GBP/USD the Chaikin Volatility indicator spikes upwards as market break to new highs. It peaks out just before the market makes a final top and declines sharply. The indicator settles at a low level as the market moves into a trading range again.

Chaikin Volatility can be used in trading Stocks, Exchange Traded Funds, Forex, Commodities, Bonds, Futures, etc. Traders should always implement appropriate risk management and stop loss strategies.
Return to Top of Online Forex Trading Systems: Chaikin Volatility
Return to Volatility Indicators