Online Stock Market Trading
Accumulation / Distribution Line
Online Stock Market Trading – Accumulation/Distribution Line (ADL): This indicator was developed by Marc Chaikin who also created Chaikin Volatility and Chaikin Money Flow. It’s similar to the On Balance Volume Indicator but is calculated in a different way. The ADL is calculated using the closing price and the volume for that trading period. The closing price is assessed relative to the day’s trading range. Using a daily bar chart, for example, a high close on the daily trading range produces a positive slope. The buying pressure is stronger and produces a high closing price. A low close on the day produces a negative slope because the selling pressure is stronger. The calculation is a little complicated but most charting packages provide the indicator automatically.
ADL for a daily time period is calculated using the following process:
Step 1: Money Flow Multiplier = [(Close – Low) – (High – Close)] ÷ (High-Low)
Step 2: Money Flow Volume = Multiply the result by the daily volume
[(Close – Low) – (High – Close)] ÷ (High-Low) * Daily Volume.
Step 3: ADL = Previous ADL + Current Period's Money Flow Volume.
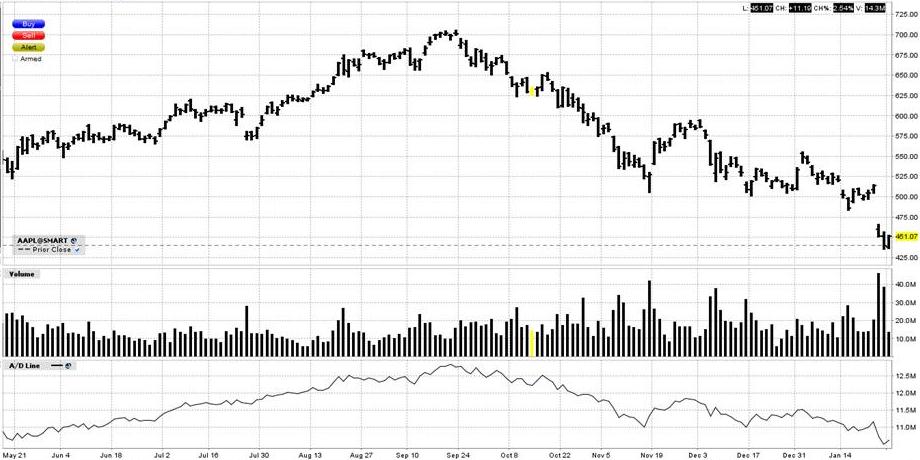
The simplest use of Accumulation/Distribution is to confirm a trend. The daily bar chart of Apple below is in an uptrend from May to September and the ADL acts as a confirmation indicator tracking upwards. Similarly, as the indicator loses momentum and turns downward, the market changes to a downtrend.

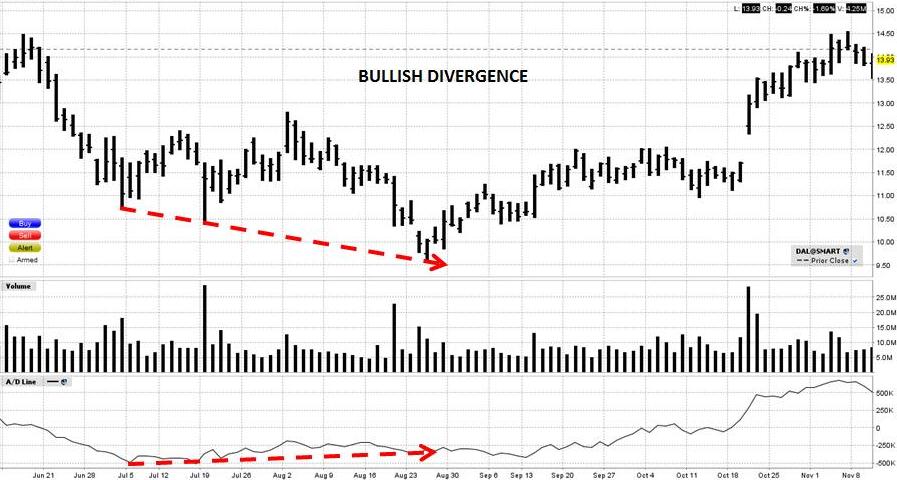
Bullish and Bearish Divergences between ADL and price are another way to interpret market behaviour. A bullish divergence is demonstrated in the next chart of Delta Airlines. Prices form a bottom in July, advance to new highs and decline again to form a lower bottom. However, the decline to new lows is not accompanied by a similar decline in the ADL. This indicates that there is a lack of conviction in the decline and to prepare for a possible advance which did manifest.

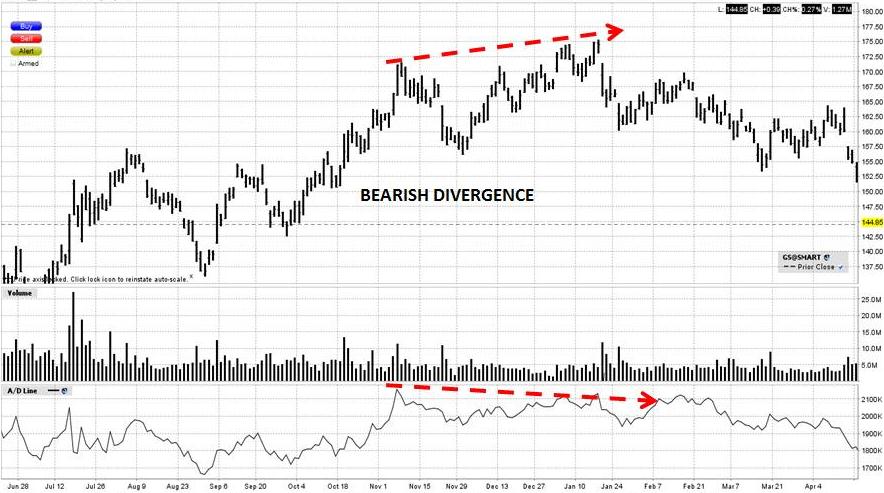
Bearish divergence is a similar phenomenon that occurs at the top of the market. Examine the next chart of Goldman Sachs. Prices form at top in November, decline to new lows and advance again to make a higher top in January. However, the ADL does not confirm conviction in the move as it does not accompany the price movement. Traders may interpret this as a sign that the market is about to decline and go short because of the lack of buying pressure to support the price movement.

Online Stock Market Trading: Accumulation/Distribution Line
Be aware that the Accumulation/Distribution Indicator may not account for gaps. The closing price could close at the top of the daily range which the ADL interprets as a positive move. However, the market may have gapped downwards at the start of the day. Although it closes high relative to the daily range, the close may still be significantly below the previous day’s action. As with all indicators it provides no guarantees and should be used in combination with other technical analysis indicators such as Momentum Indicators or Chart Patterns. It can be applied to Stocks, Exchange Traded Funds, Forex, Commodities, Bonds, Futures, etc. Traders should always implement appropriate risk management and stop loss strategies.
Return to Top of Online Stock Market Trading: Accumulation/Distribution Line