Gaps
Stock Charts
Gaps on stock charts can be a good indicator of the future direction of a market and traders should take notice when they occur. Gaps are a term used in technical analysis to describe a situation when a market opens above or highest price or below the lowest price of the previous days trade and do not close the gap that is created in that day of trade. Essentially it is a space where no trading has taken place.
Gaps can occur anytime in any time frame but tend to be more frequent when important news relating to that particular market comes out or if there is a surprise development. For example, stock traders keep an eye on earnings announcements because they can result in a gap. Because stock markets are closed overnight and during the weekend the market can open up with a gap over that period.
There are four types of gaps: Common, Runaway (Measuring ), Breakdown and Exhaustion gaps and may be interpreted in different ways.
A common gap is a gap which is filled fairly quickly after it occurs; that is the market trades back into the area of the gap. For example, as in the accompanying daily candlestick chart of Halliburton. This type of gap may occur because there is light volume in that stock or there is initial excitement during the time of the gap after which sentiment changes and the market alters direction again.
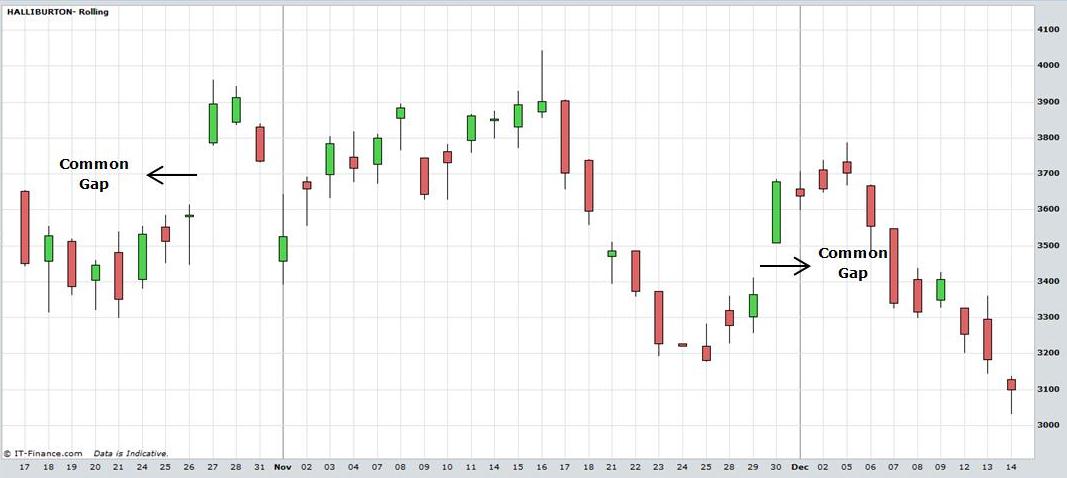
Gaps. View chart in interactive mode at ProRealTime.com.
Runaway gaps often take place in the direction of the trend. For stock traders they are an important signal in technical analysis as it can be interpreted as a sign of increased interest in a stock and continued movement in the direction of the gap. An increase in volume is a sign of conviction behind the move. The gap may not be filled for weeks or even months as the market continues its strong run. The reason they are also referred to as measuring gaps is because some analysts interpret the gap as occuring half way through a trend.
Futures commodity contracts have limit moves imposed by the trading exchange. A maximum threshold up or down is allowed before the market halts trading. It’s a way to control irrational and massive moves up or down and allow a breathing space for the markets to calm down. The exhange will halt trading if the market moves a certain amount of points. So a futures commodity contract can gap up or down by the limit even for a few days in a row. If the trader is on the right side of the market it is very profitable and the converse is also the case.
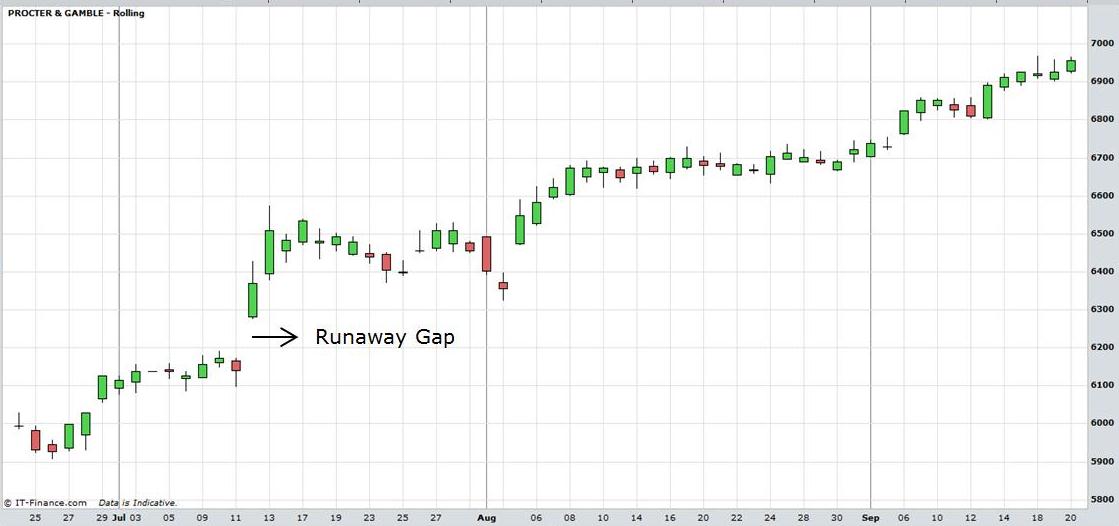
Stock Charts: Gaps
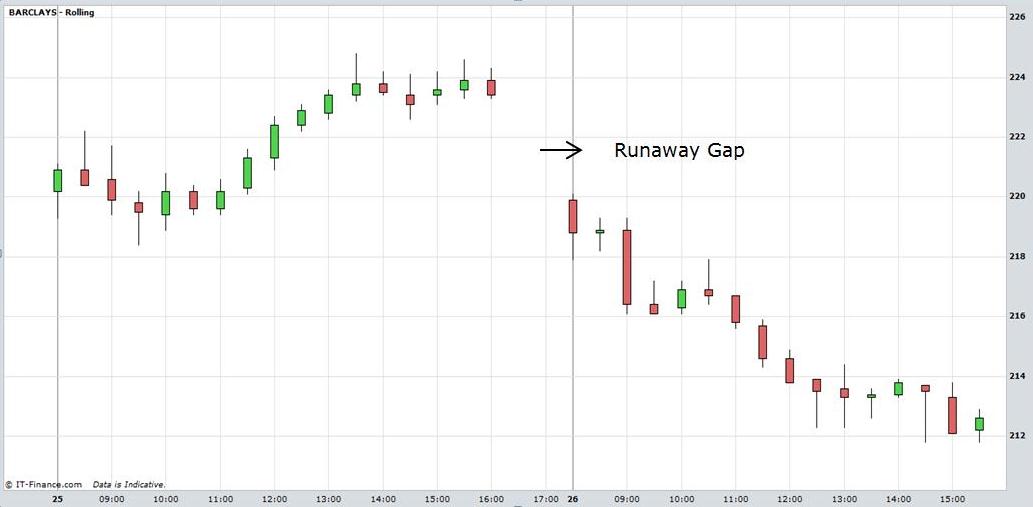
Stock Charts: Gaps
Breakaway gaps occur after a period of consolidation in the market. Consolidation is when the market trades sideways in a range, failing to make new highs or lows. A sideways market may signfiy a lack of interest or simply a waiting period before the next move up or down. One day the market breaks out decisively above or below the trading range and ends the period of consolidation as is demonstrated by the charts of Pfizer and Pepsico.
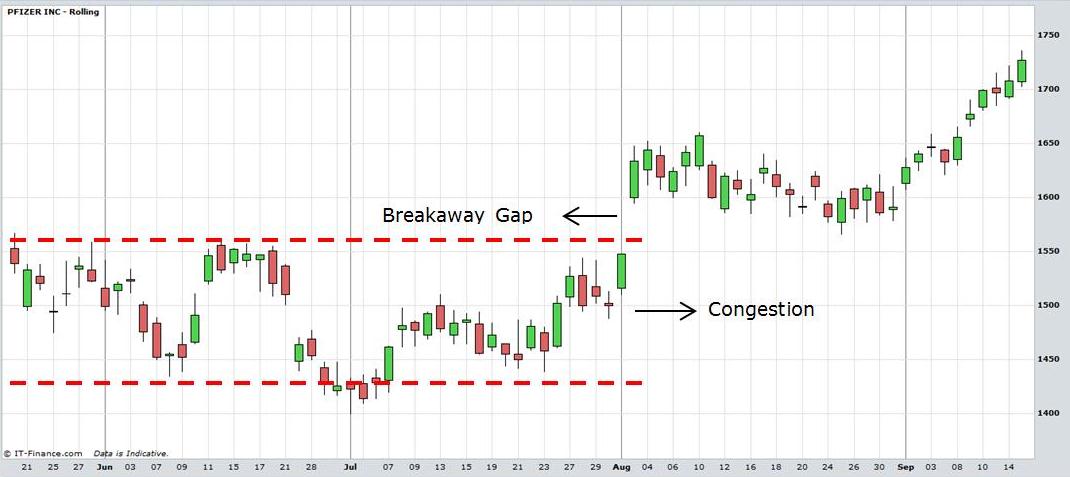
Stock Charts: Gaps
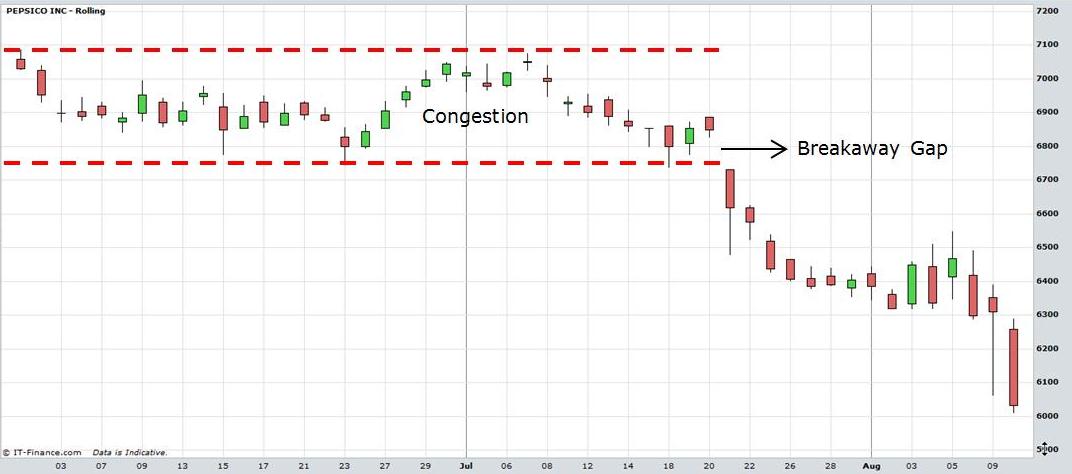
Stock Charts: Gaps
An exhaustion gap
occurs at the end of an up a strong run up or down in the market. At the top its
like the markets final gasp, one last lunge upwards before a fall in prices,
often a dramatic one. It may be accompanied by euphoria and huge volume as
everyone buys into the stock. Once the euphoria subsides there is a realisation
that there are no buyers left. After that there is only one direction a stock
can go. Some traders use this as an opportunity to go short.
At the bottom of a sustained decline in prices a gap is down is usually a day of high drama and panic in the market. The volume of trading is high as owners of the stock capitulate and sell out their positions. The market can then suprise everyone and have a strong rally as sellers suddenly dry up and buyers rush back.
At the time they occur, an exhaustion and runaway gap will look the same on a chart. Stock traders won’t know which it is until later trading sessions. However, traders who know their market well will have an edge. Knowledge of past history can help to identify which type of gap it will be.
As with all trading it is important to implement effective risk management and stop loss strategies.
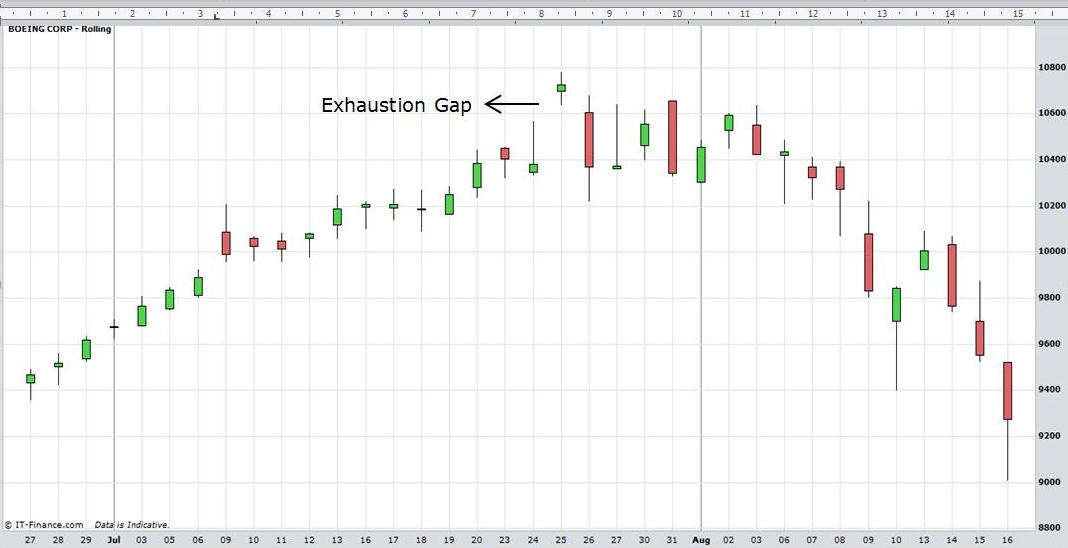
Stock Charts: Gaps. View chart in interactive mode at ProRealTime.com.
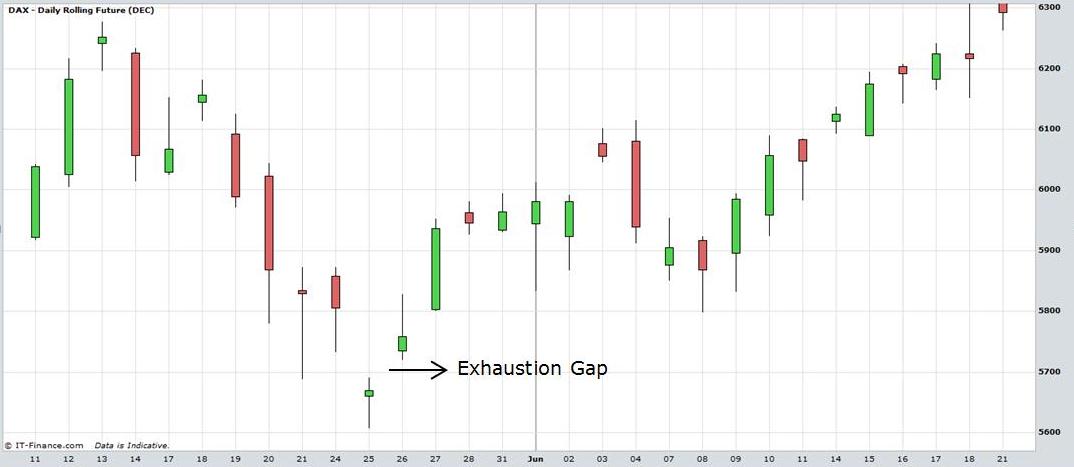
Stock Charts: Gaps. View chart in interactive mode at ProRealTime.com.
Return to Top of Stock Charts Gaps
Return to Technical Analysis Charts